


Table of Contents
About ASIA
In contrast to traditional group communication systems, publish/subscribe systems focus on scalability and to that end sacrifice strong semantics. Membership is typically one aspect of publish/subscribe systems that is associated with weak semantics because view control mechanisms can easily become a bottleneck with increasing numbers of participants, especially as these join and leave frequently. Anonymity among participants in publish/subscribe communication is viewed as one of the main contributors to scalability next to asynchrony. While some applications may indeed not need information on participating entities, many current and future applications rely on information on their client population.
In this project, we are working on lightweight support for gathering aggregation information (e.g., client population) in content-based publish/subscribe systems. However, it does not focus on a specific kind of aggregation. Instead, it generalizes at the infrastructure level: each application can request its own specific type of aggregation information.
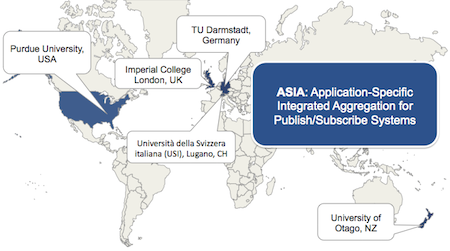
This work is based on an international cooperation between TU Darmstadt (Germany), Purdue University (USA), Imperial College (UK), University of Otago (New Zealand) and Vrije Universiteit Amsterdam (Netherlands).
News
Source Code and Implementation
ASIA is based on the REDS open-source pub/sub middleware. An additional implementation is focussing on the ActiveMQ open-source messaging middleware. The source code is available upon request.
REDS provides a framework of Java classes and defines the architecture of a generic broker through a set of components with well-defined interfaces. The current release of REDS offers concrete implementations for each component, most of which are appropriate for our aggregation mechanism. This limited the implementation effort to the development of a small number of classes.
ActiveMQ is representative of an industrial-strength messaging system and supports J2EE 1.4 and JMS 1.1. It is part of several open-source enterprise service bus implementations such as Apache ServiceMix or Talend ESB.
Aggregations implemented
Currently, we have the following components for each type of aggregation deployed in the REDS-based implementation of ASIA:
- Application logic: distributed across the broker network
- Aggregation request messages: sent by subscribers/publishers
- Aggregation update message: sent by the brokers
- Aggregate value (e.g. sum or average functions): used by the brokers to aggregate and disseminate updates
The application logic for aggregations in ASIA consists of a sensing/computing and a dissemination/aggregating part. The sensing/computing part is triggered on the edge brokers when triggering messages come in. Depending on the type of aggregation, triggering messages could be: advertisements, subscriptions, unsubscriptions, or publications (published events). The sensing/computing part on an edge-broker updates the local values for each aggregation and determines if other nodes have to be updated (i.e., the current value is outside a tolerated imprecision range of the last update's value). If this is the case, the update is piggybacked to the incoming (and now forwarded) message if possible.
The dissemination/aggregating part is triggered by messages being forwarded within the broker network (inner brokers) carrying piggybacked updates for aggregations. The current local value for each aggregation is compared to the most recently arrived update. If the difference between update and current value is outside a specified boundary of imprecision, the local value is updated and the node decides who has to be notified about the new local value. In that case, the new update is piggybacked to the forwarded message.
Subscribers and publishers express their interest in certain aggregations by sending aggregation requests to the broker network. They trigger the respective aggregation updates being sent back once updates inside the broker network require an update. Subscribers and publishers receive the aggregation update message containing the latest value known to the broker network at that time with respect to the specified degree of impression.
The following aggregations are currently implemented in ASIA:
-
Related to publishers:
- Advertisement count
- Number of advertisements being registered for a given topic. Triggered by an advertisement message, piggybacked to it or to an aggregation update coming along.
- Publisher count
- Number of publishers for a topic currently known to the broker network. Triggered by published events coming in at the edge brokers; updated by messages being forwarded through the system. A TTL in seconds can be configured that determines how long the sighting of a specific publisher of topic is valid. If enabled, this option leads to increasing and decreasing aggregation updates. If set to 0, publisher count updates expose the same behavior as advertisement count updates (always increasing).
- Publication rate
- Number of publications for a topic within a configurable length of time. Triggered by published events coming in at the edge brokers; updated by messages being forwarded through the system.
-
Related to subscribers:
- Subscriber count
- Number of subscribers being subscribed to a given topic. Triggered by subscription and unsubscription messages, piggybacked to them or to an aggregation update coming along.
- Subscription rate
- Number of subscriptions for a topic within a configurable length of time. Triggered by subscriptions coming in at the edge brokers; updated by subscriptions being forwarded through the system.
- Subscription/unsubscription ratio
- Ratio between subscriptions and unsubscriptions for a given topic. Triggered by subscriptions and unsubscriptions being passed through the system.
A specific aggregation type can be configured to be available for publishers or subscribers only (if necessary).
Depending on the aggregation type and its triggering message, different aggregations have different update cycles. For example, aggregations based on the number of advertisements may have longer/fewer update-cycles than those being triggered by every incoming publication. This may lead to different additional loads to the system. Nevertheless, the difference should be minimal as updates are usually triggered by incoming/forwarded messages and are directly piggybacked to them.
Dashboard prototype
We have implemented a dashboard to visualize metrics provided by ASIA. We have realized our dashboard using industry-strength software provided by our industry partner Software AG and J2EE. Our prototype is currently providing data-centric and client-centric views to support IT service management (ITSM) in governing EBS at runtime. A full description of these views can be found in the paper "Effective runtime monitoring of distributed event-based enterprise systems with ASIA" by Frischbier et al., to be presented at SOCA 2014.
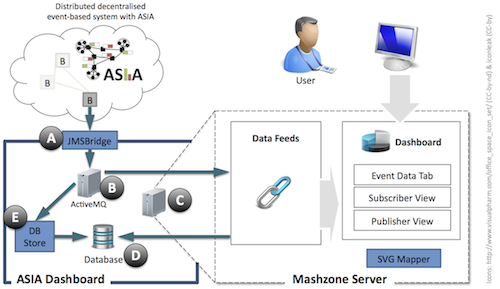
ASIA reports updates about the state of a distributed and decralized event-based system (EBS) to JMSBridge (A).
JMSBridge is a simple event listener implemented in Java and requests updates for the
those monitoring metrics that are displayed on the dashbaord. It is connected as a platform-specific subscriber to a broker of the EBS
supporting ASIA and as JMS message producer to an ActiveMQ messaging server (B) for forwarding monitoring updates.
Please note that ASIA does not require JMSBridge to be connected to a dedicated broker:
ASIA establishes and maintains a global view on the system state across all brokers.
Upon being updated by ASIA, JMSBridge is notifying our dashboard about the metrics changed by forwarding the updates to the Mashzone server (C) as JMS messages.
A copy of the received updates is also saved to a MySQL database (D) by DBStore (E) for detailed ex-post analysis.
The Mashzone server provides a web-based dashboard, and uses JMS to receive runtime updates for metrics from the ActiveMQ messaging server.
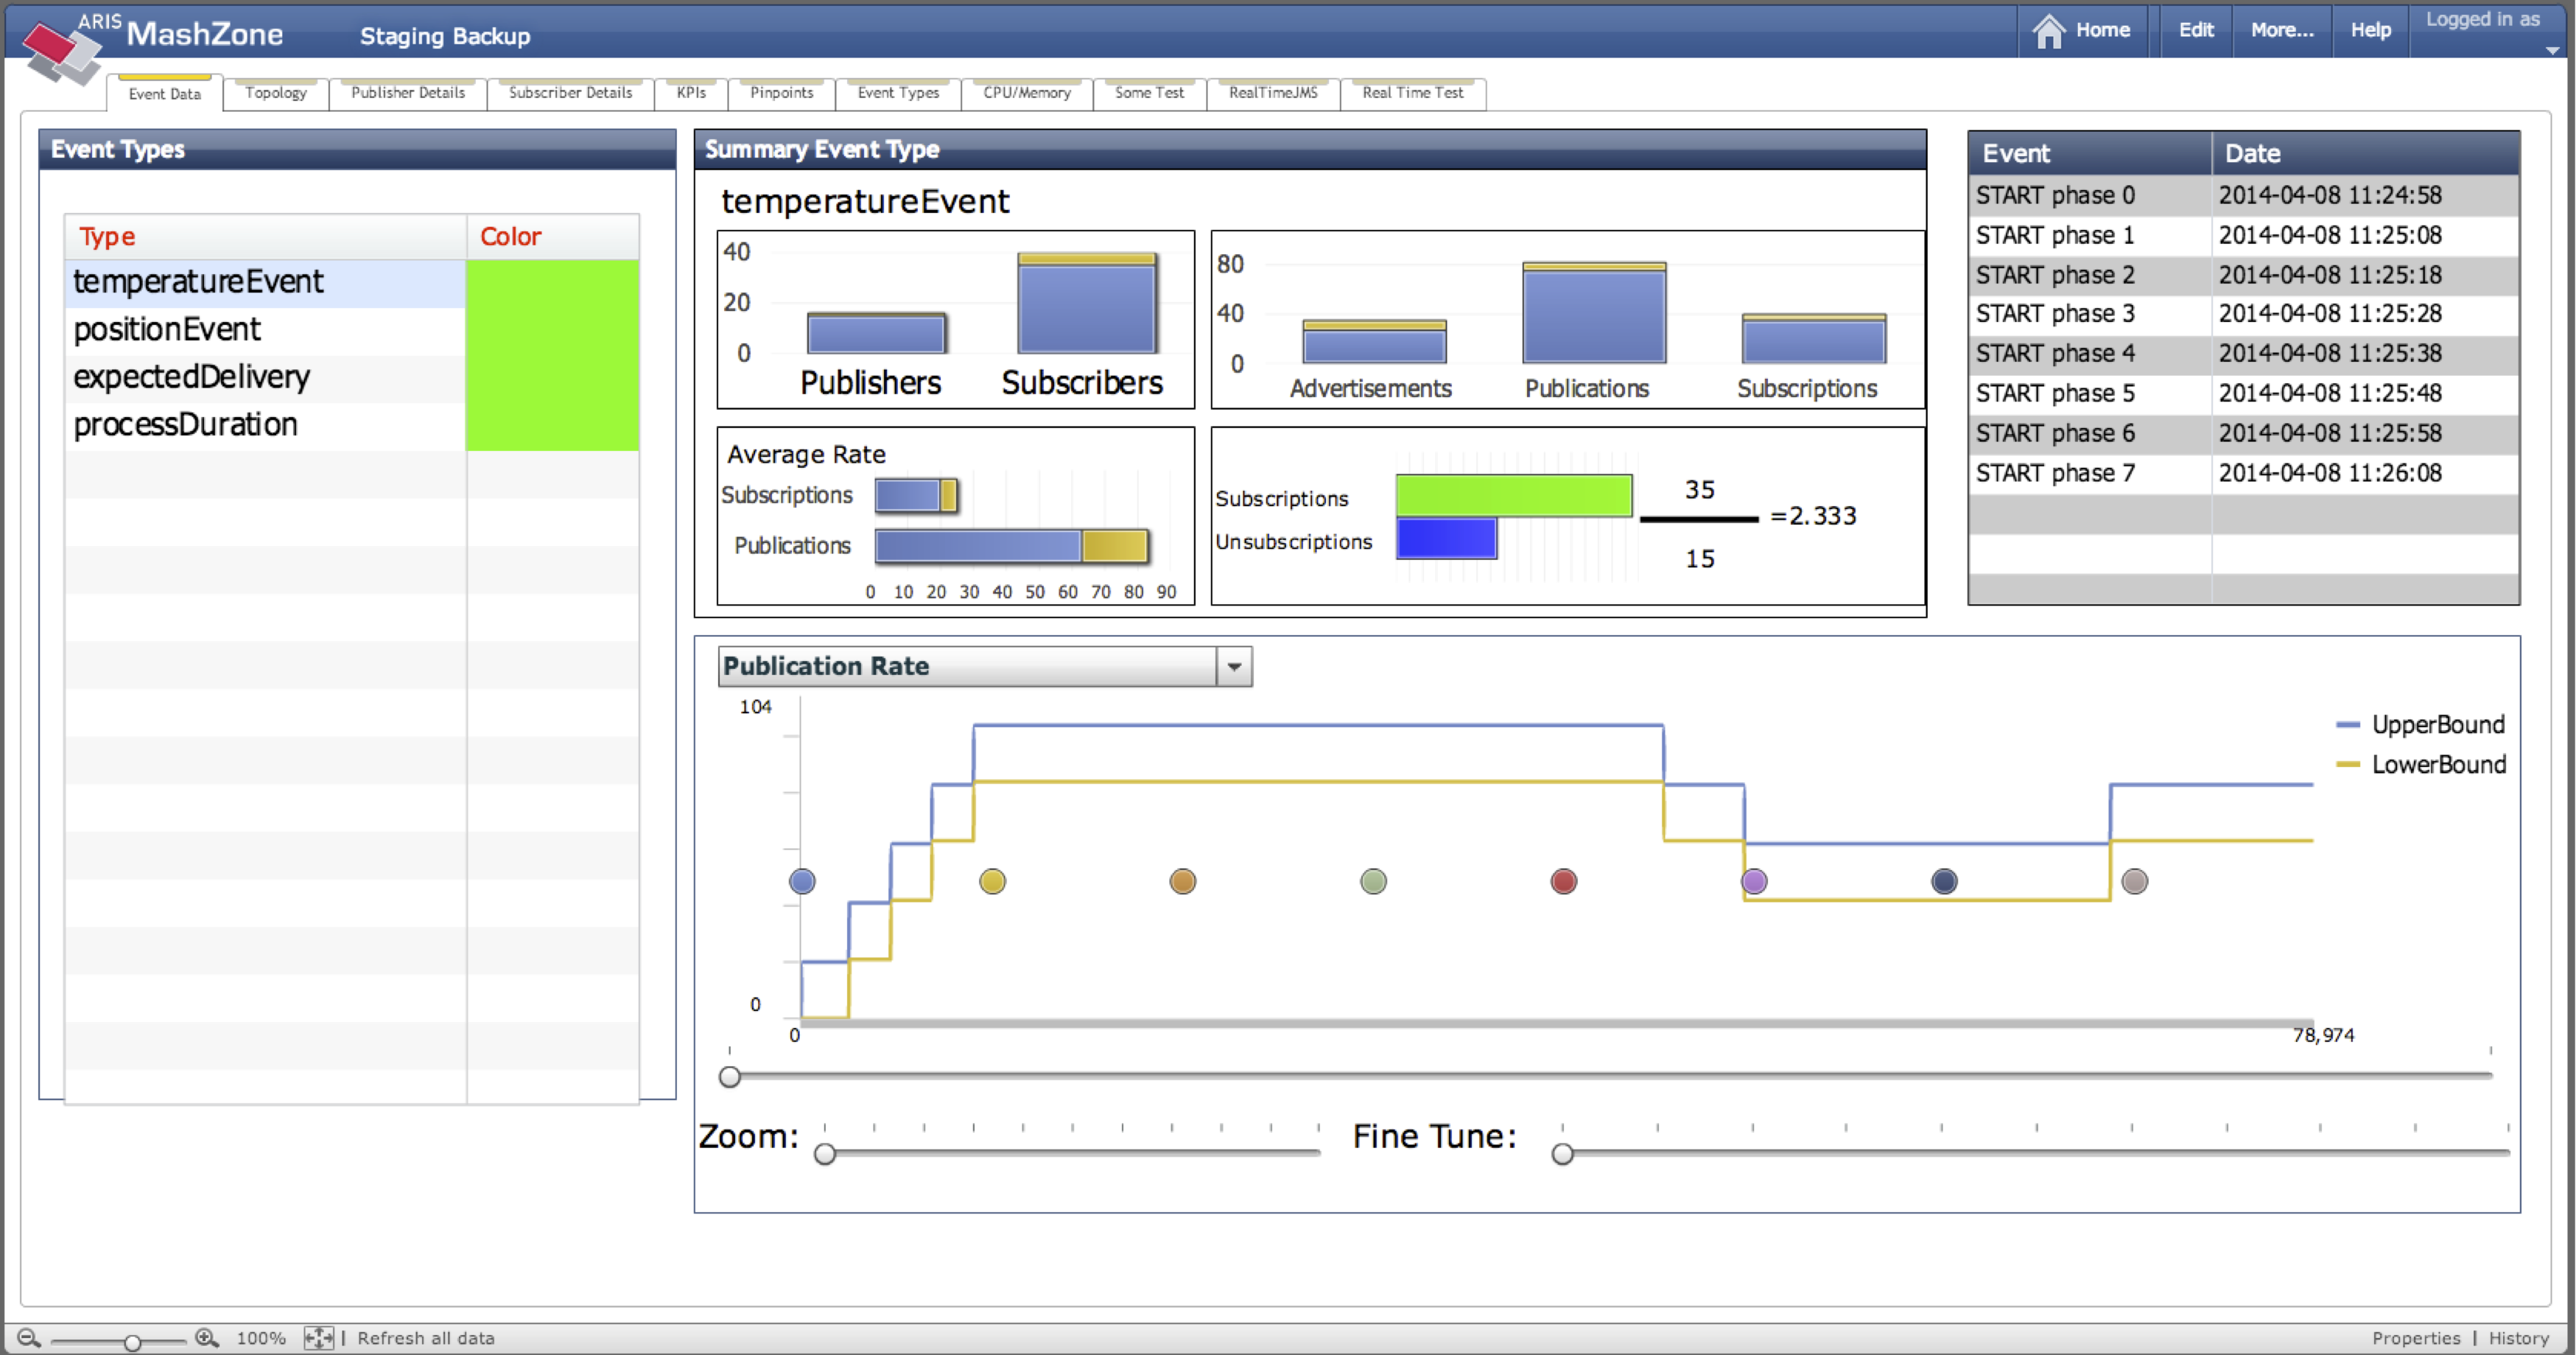
The data-centric EventDataTab provides an overview of all event types currently handled by the system. It displays aggregated runtime information about the total population of active subscribers and publishers for each type. At the bottom of the tab, the progression of each metric over time is visualized using the data traces stored in the separarte MySQL database.
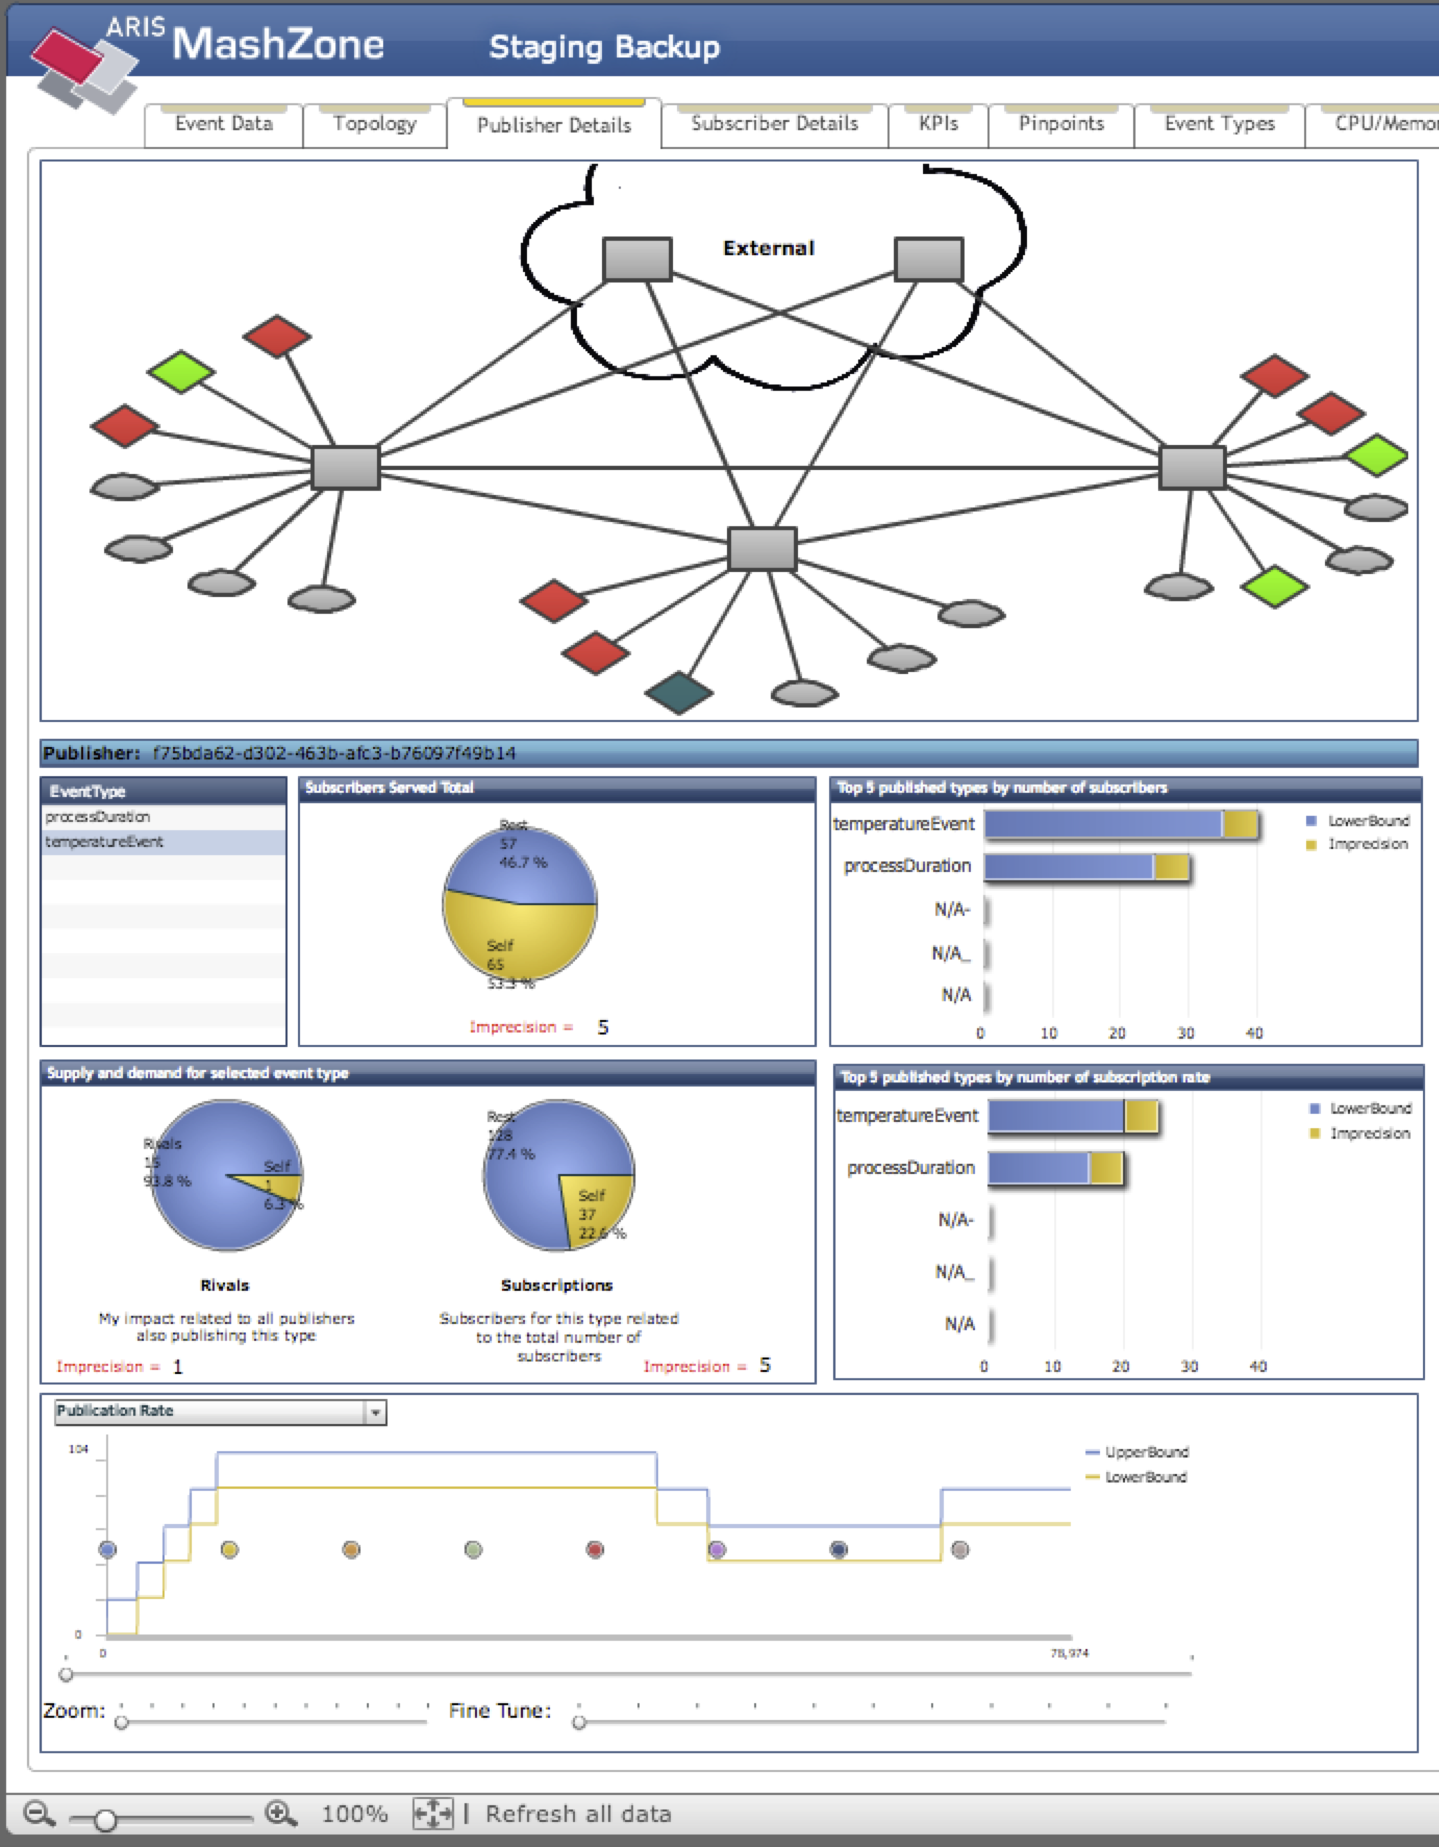
The data-centric PublisherDetailTab is available for each publisher in the system (and under control of ITSM). It displays aggregated runtime information about the event types produced by this publisher and the importance of this publisher for the EBS.
About the Testbed
We use a testbed consisting of 80 machines with a shared file system located at Purdue University, Department of Computer Science. For our current evaluation of ASIA we use two fractions F1 and F2 consisting of 40 machines each. F1 consists of aXX and bXX machines while F2 consists of cXX and dXX machines. The following table shows their configuration.
| aXX | bXX | cXX | dXX | |
|---|---|---|---|---|
| OS | GNU/Linux | GNU/Linux | GNU/Linux | GNU/Linux |
| Type | x86_64 | x86_64 | x86_64 | x86_64 |
| CPU | i7-2600 | i7 | i5 (8 core) | Xeon (8 core) |
| GHz | 3.40GHz | 2.80GHz | 3.10GHz | 1.86GHz |
| Memory | 8GB | 4GB | 4GB | 8GB |
Performance Evaluation
Topology used
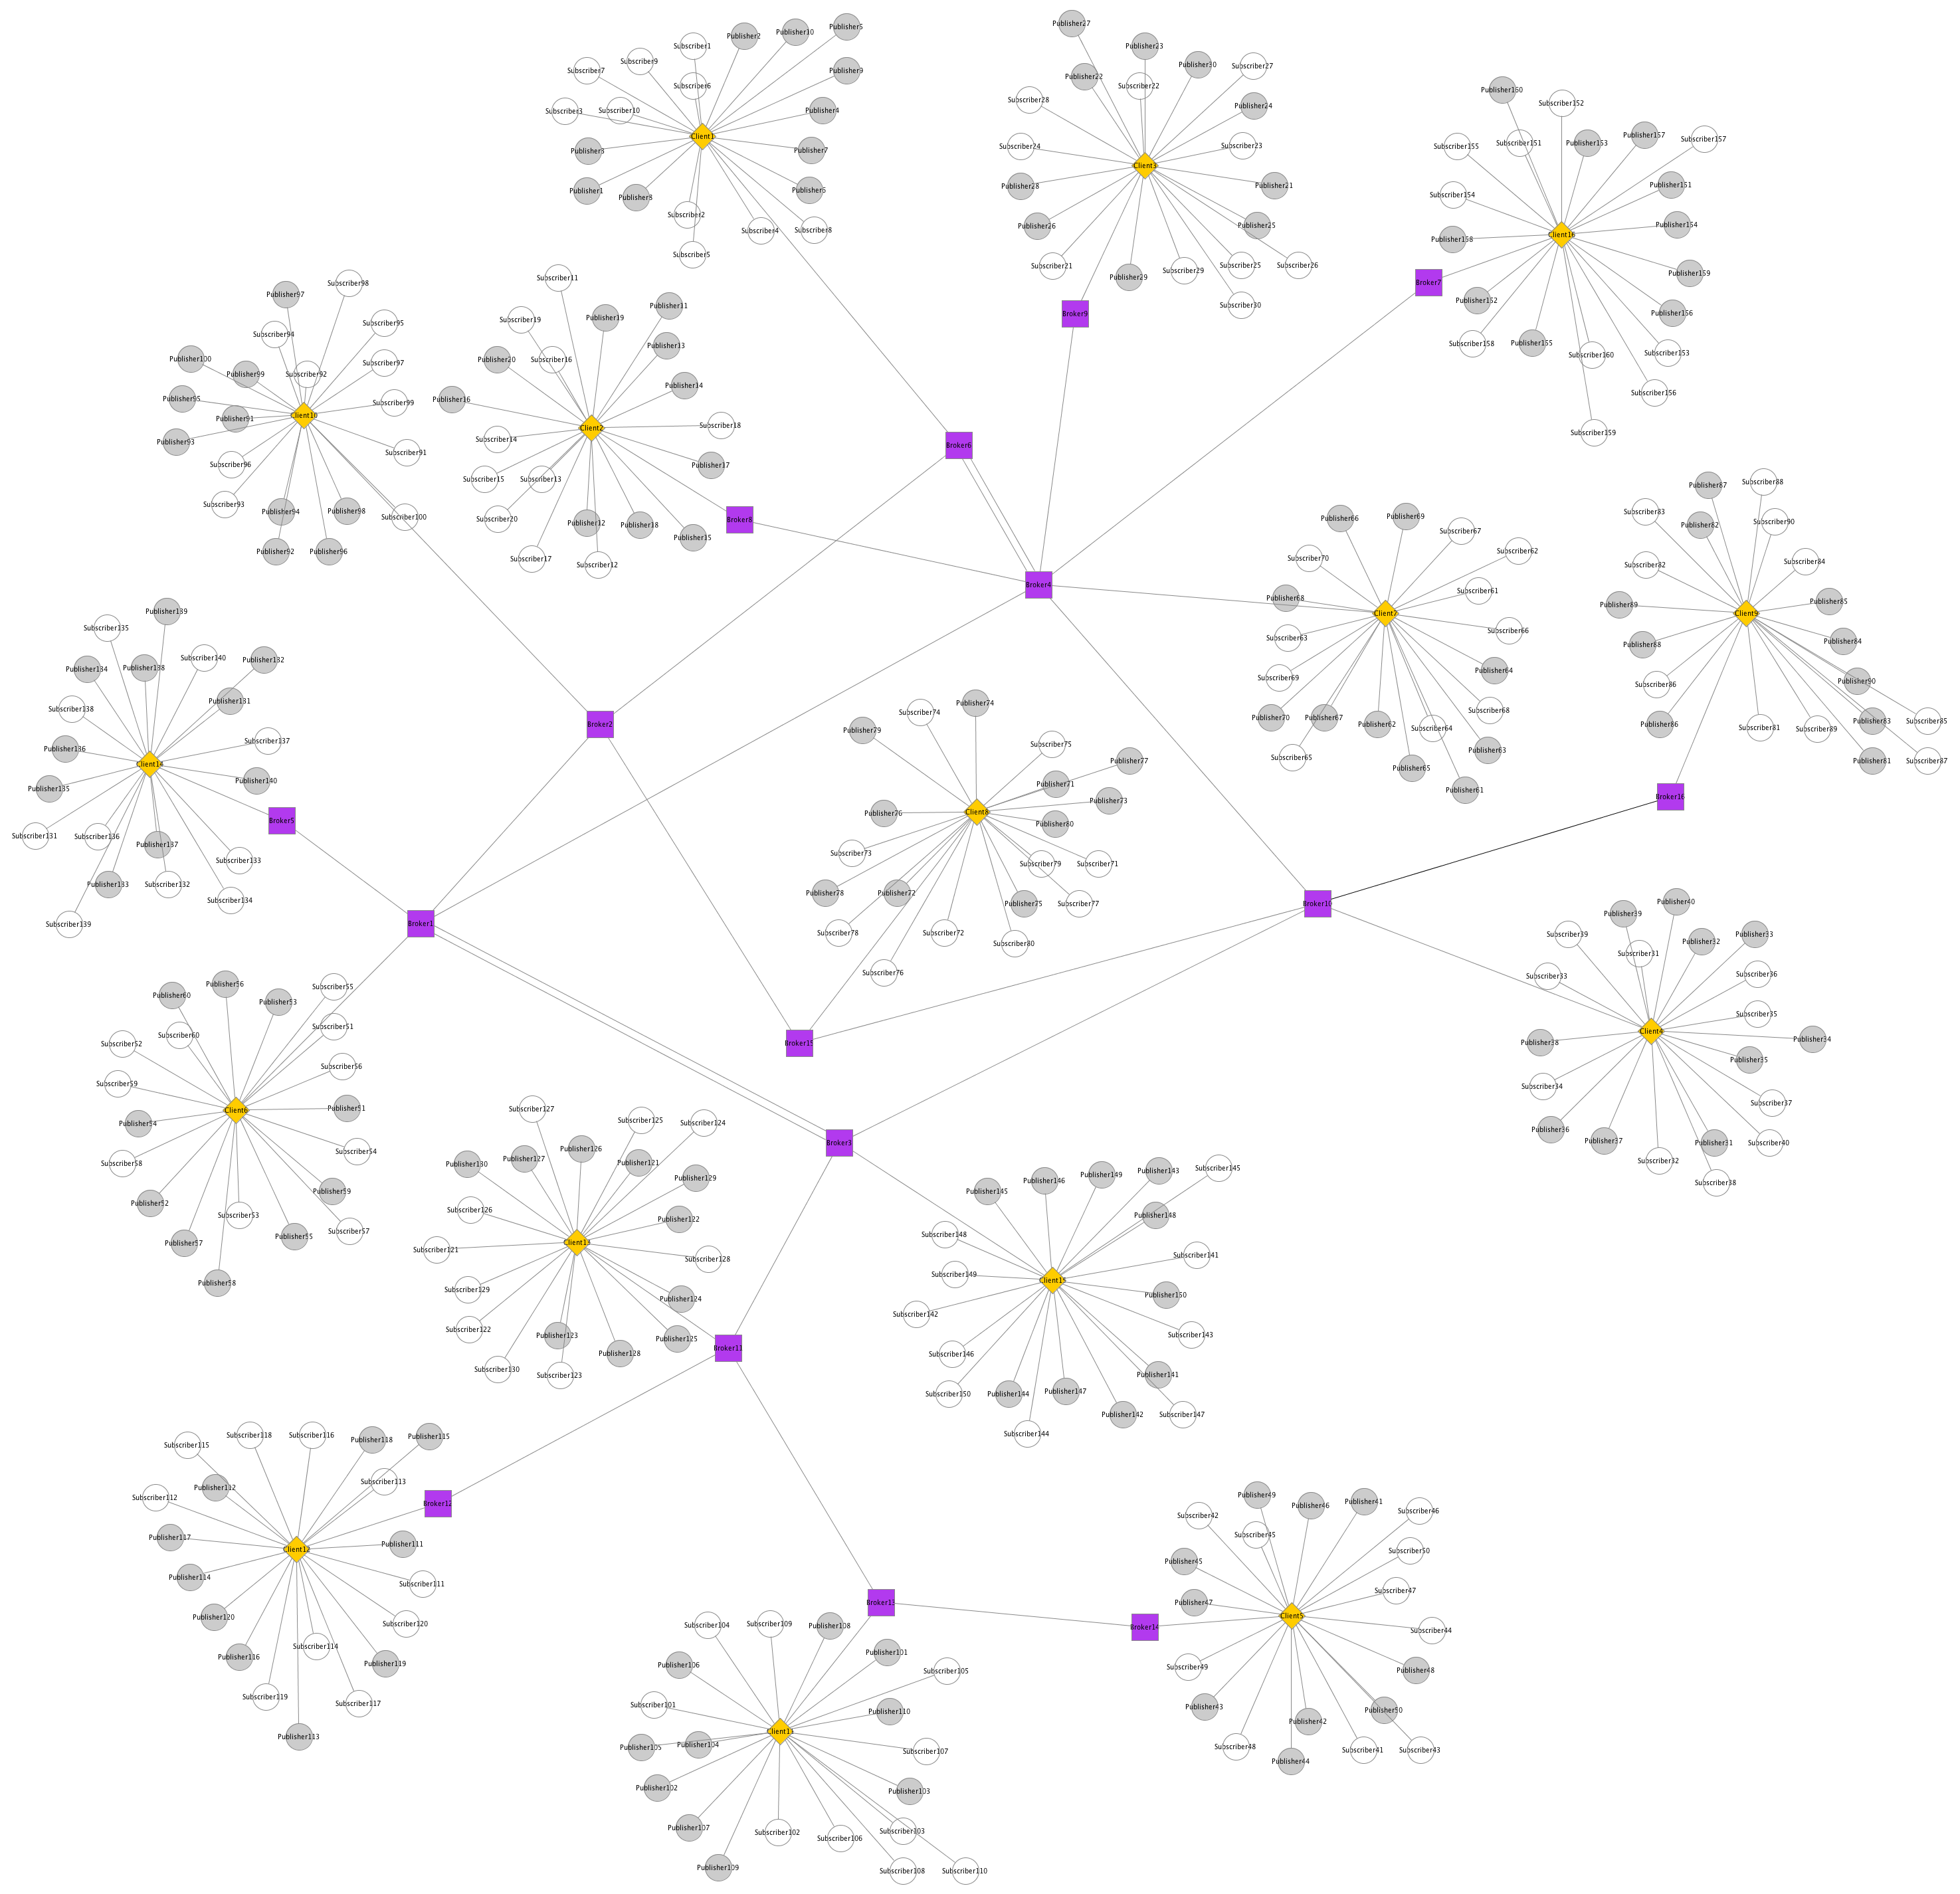
For evaluating the performance of ASIA, we adopted a number of randomly generated topologies. A specific example is shown in the following Figure. It consists of a network of 16 brokers, each one connected to a (virtual) client handling 50 publishers and 50 subscribers. For simplicity, only 10 publishers and subscribers per virtual client are shown in the Figure below.
Albeit simple, this topology includes all the aspects we considered during our evaluation: we deployed a large number of clients, submitting publications and subscriptions at a high rate, to stress the system; clients and brokers were hosted in separate physical machines, enabling them to use all the available hardware resources for generating and processing packets and for forwarding them; multi-hop routing is required to enable the communication among clients.
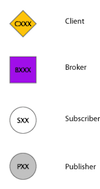
| Map legend |
|---|
 |
Measured results
We present here some of the most significant results we collected during our evaluation of ASIA. For the results presented below, we focused on different aggregation functions, e.g. subscriber count, as well as and their combination. Thanks to subscriber count, each publisher receives information about the number of subscribers interested in the information it publishes. This may help publishers to tune the content of their message, or the publication rate, based on the interests of subscribers.
Network traffic
We investigated the advantages of integrating aggregation with a publish/subscribe system, in terms of network traffic induced. Indeed, ASIA is capable of reducing network traffic by piggybacking aggregation updates to the packets exchanged between brokers, whenever possible.
Moreover, to lower the traffic even further, if required, ASIA enables clients to specify a maximum imprecision they tolerate in the aggregation value. Larger imprecisions allow the ASIA middleware to reduce the number of aggregate update exchanged among brokers, thus reducing the traffic overhead introduced by aggregates.
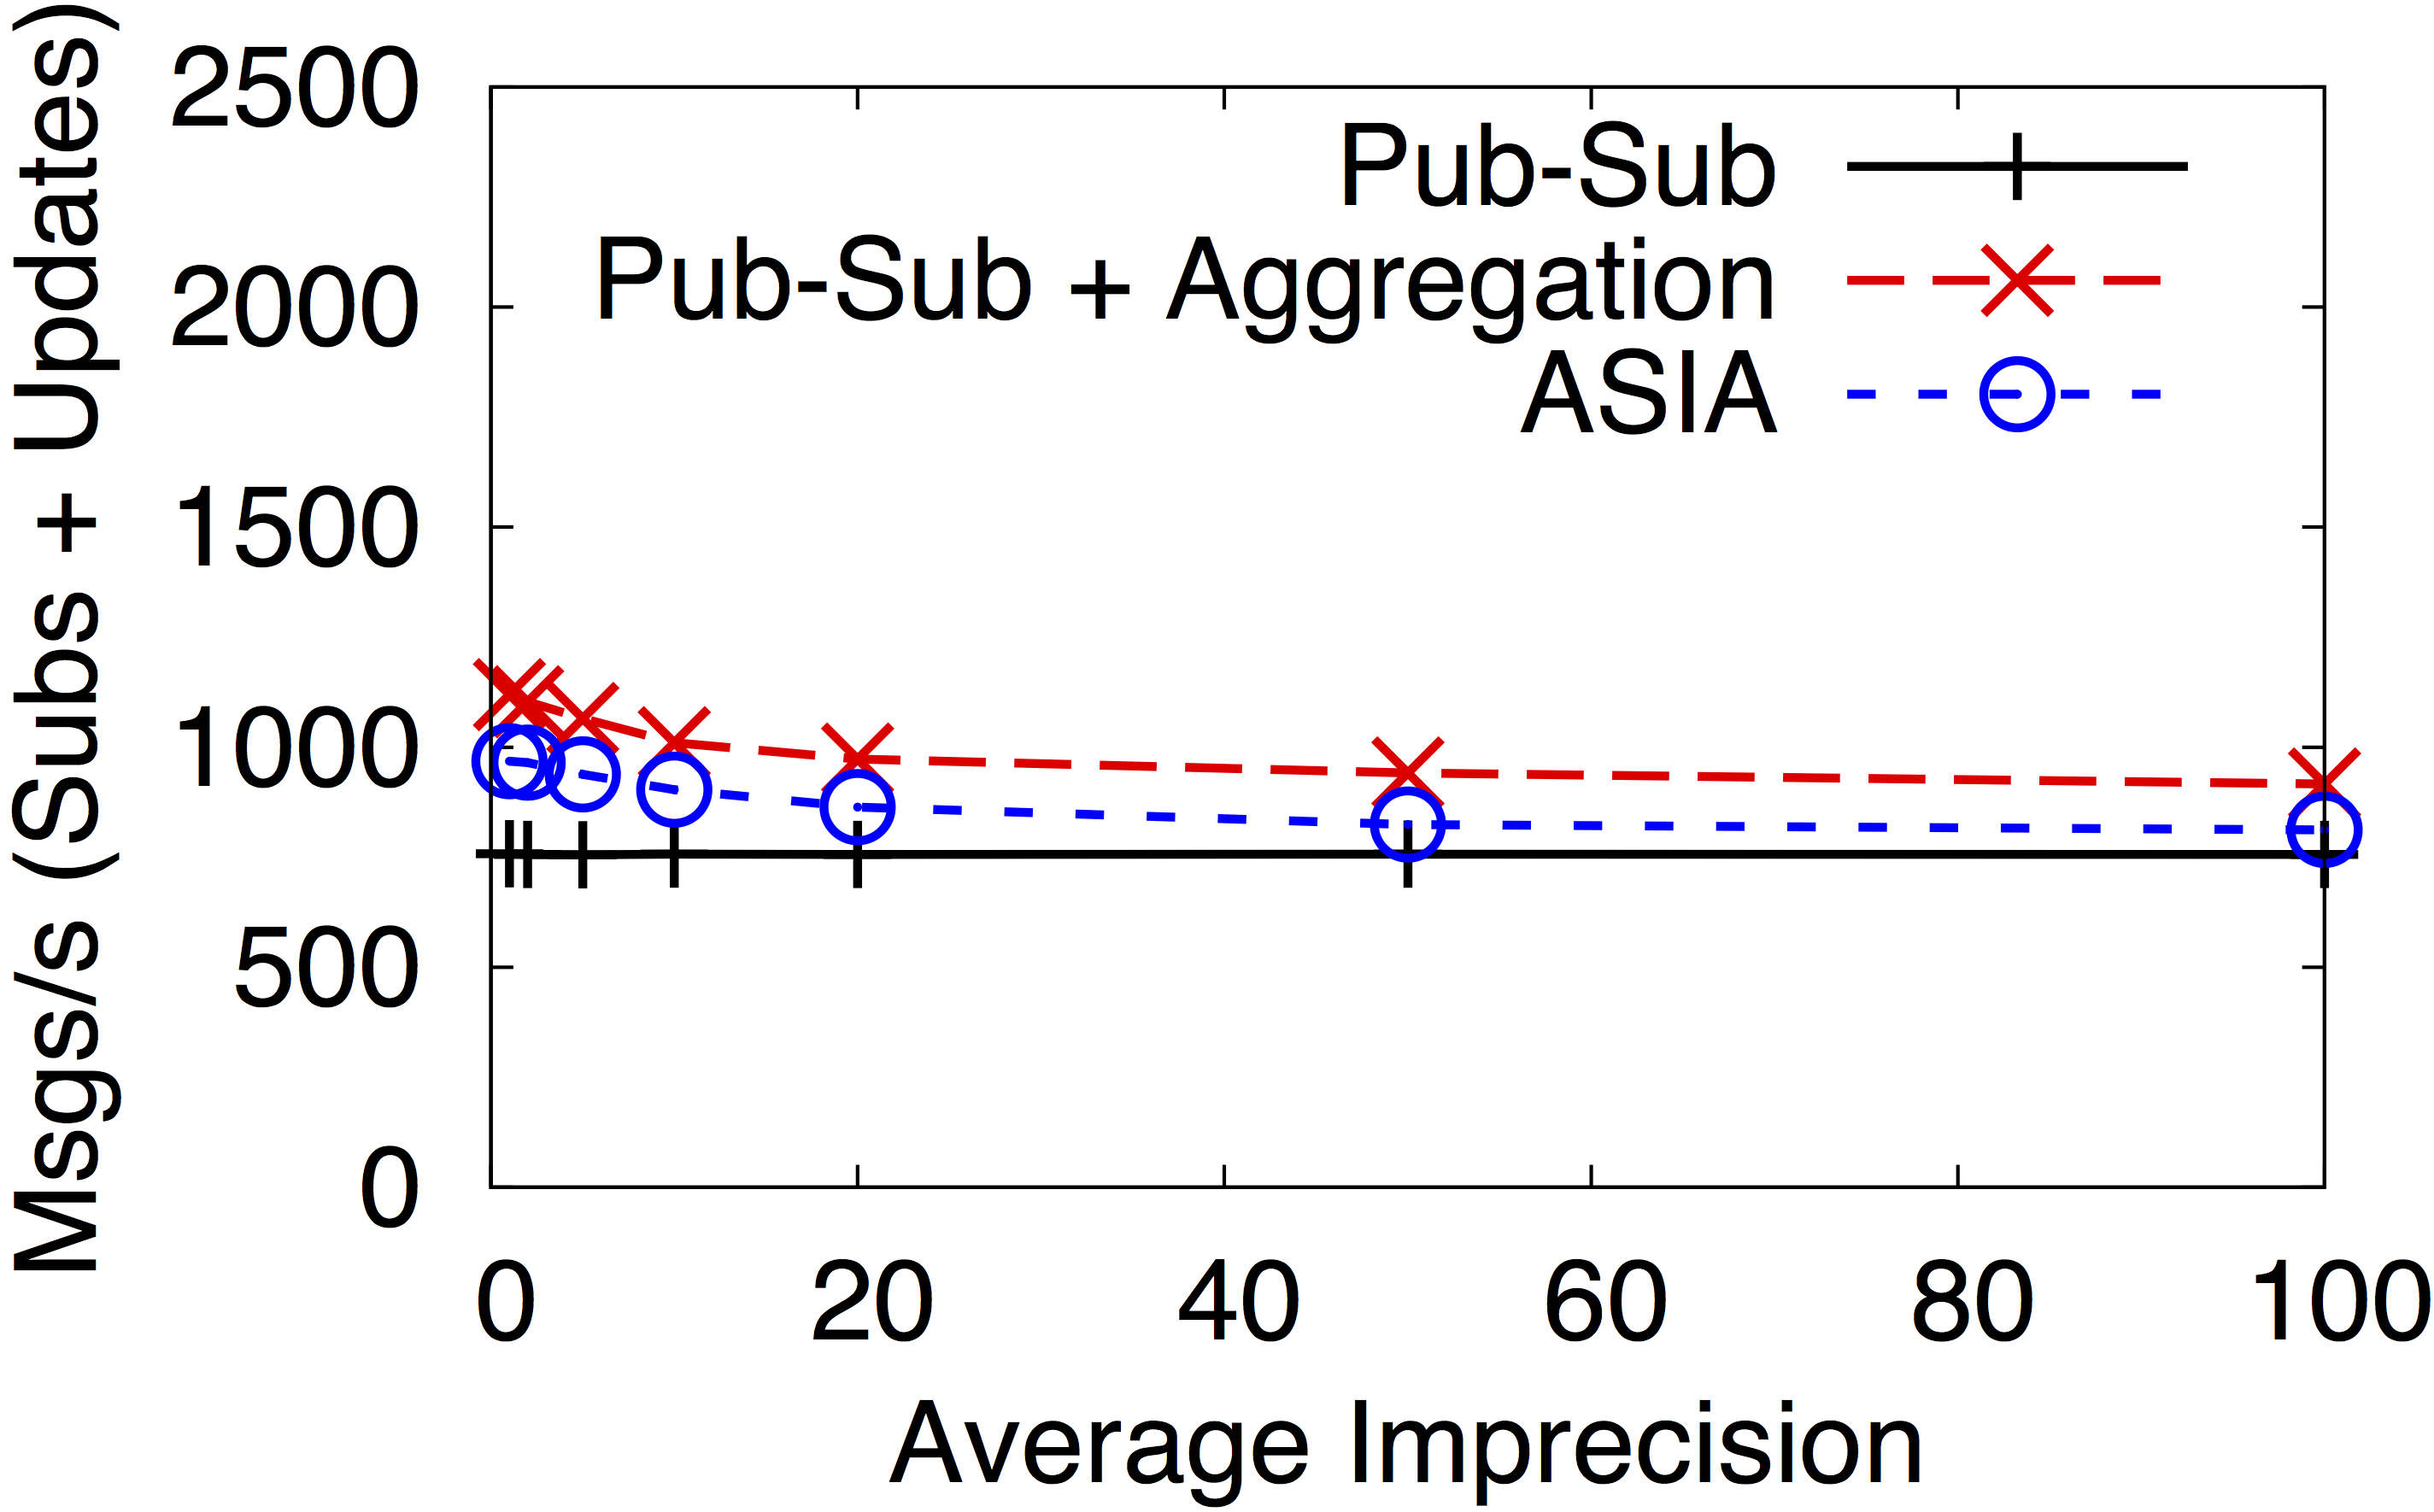
In the Figure below, we compare (1) our integrated publish/subscribe aggregation model (ASIA) with (2) a solution that uses two separate systems, one for the publish/subscriber communication and one for the aggregation, and (3) just the publish/subscribe system. For (2), both systems run in parallel on the same nodes, using the same overlay topology. We measure the network traffic, including the communication between clients and brokers, generated by subscriptions and aggregation updates; we omit the traffic generated by publications because it is identical for all setups.
As shown in the Figure below, ASIA introduces a low traffic overhead for computing the subscriber count aggregation and delivering the updates to the interested clients. Most importantly, the integration with the publish/subscribe system, enables to optimize the delivery of updates, thus providing lower overhead with respect to a separate solution.
Finally, the overhead decreases when a higher imprecision is allowed. Not only does ASIA exhibit a low overhead, but ASIA's traffic is close to that of the baseline publish/subscribe system at higher imprecision levels, despite providing aggregation information.
Propagation delay
An important metric for aggregation is the delay for propagating updates. We analyzed ASIA's propagation delay, comparing the results with those of a separate aggregation system running in parallel. Since the propagation delays depend on the specific overlay network, we consider four different settings for the aggregation system: (i) the same overlay as ASIA; (ii) a comparable overlay, i.e., an overlay with the same average number of outgoing links at each broker; (iii) a ring overlay; and (iv) a centralized solution in which a single node receives all subscriptions and delivers updates to clients.In this experiment we do not allow imprecision in the subscriber count so that all updates are immediately delivered to all interested clients.
The Table below presents the delay as measured at the clients. We notice that all the configurations exhibit an average propagation delay of more than 10ms. This is caused by the use of REDS: the round trip time in the communication between two brokers is around 2ms. If we compare ASIA to using an external aggregation system, we notice that it does not increase propagation delay and actually provides benefit. When the aggregation system uses the same overlay as ASIA, propagation delays are almost identical: the slightly higher average delay is most likely due to the computational overhead on broker nodes when instantiating two separate systems.
This holds when we consider a different overlay with the same average number of hops. For a ring overlay, we see a similar average delay but the 95th percentile and the maximum delay increase. This means that despite some updates being propagated quickly, e.g., those happening locally, this kind of topology increases the maximum number of hops that an update travels. Finally, the last line in the Table shows the performance of a centralized aggregation system. The average propagation delay increases significantly because all subscriptions have to move to a single node, which then propagates all aggregation updates.
| Average | 95th Perc. | Maximum | |
|---|---|---|---|
| ASIA | 12.08ms | 41.40ms | 152.82ms |
| Aggregation System (same overlay) | 12.93ms | 41.82ms | 151.93ms |
| Aggregation System (comparable overlay) | 13.46ms | 44.96ms | 149.76ms |
| Aggregation System (ring overlay) | 13.44ms | 50.58ms | 161.54ms |
| Aggregation System (centralized) | 17.38ms | 58.72ms | 208.04ms |
Event delivery delay
Beside the delay for propagating updates of aggregates, another relevant metric is represented by the delay for delivering events to interested clients. Indeed, this metric allows us to measure whether the integration of an aggregation mechanism into ASIA impacts on the performance of the publish/subscribe service.In this experiment we considered the number of active publishers as our aggregation function. We consider a publisher as active for a given topic t if it has published at least one event for t in the last minute. Intuitively, this is a challenging function for ASIA, since it requires an additional computation to be performed at each broker when a new message is published.
As in the previous experiment we do not allow imprecision in the publishers count so that all updates are immediately delivered to all interested clients. We compare ASIA against a publish/subscribe service running (1) on the same overlay, (2) on a similar overlay, and (3) in a centralized setting.
The table below presents the delay as measured at the clients. We notice that all the configurations exhibit a similar delay. The average values are lower than in the previous experiment, since we are considering a smaller topology. If we compare ASIA against a traditional publish/subscribe service, we observe that, despite providing the additional aggregation features, it does not introduce significant changes in the delay for delivering events.
| Average | 95th Perc. | Maximum | |
|---|---|---|---|
| ASIA | 7.26ms | 35.96ms | 45.76ms |
| Pub/Sub System (same overlay) | 6.84ms | 34.42ms | 44.35ms |
| Pub/Sub System (comparable overlay) | 7.61ms | 38.64ms | 55.86ms |
| Pub/Sub System (centralized) | 7.67ms | 33.5ms | 48.32ms |
Resource Utilization
We are continuously monitoring CPU and memory usage of all machines during the experiments of our evaluation. Based on this data we can show that the testbed's computer hardware is not negatively influencing our experiments. That means that the machines hosting the brokers and clients are never stressed to a level that would impact the system metrics used for evaluation.
Further, we are logging the different actions taken by ASIA during our experiments and correlate them with the measured utilization information. The following points in time are currently taken into consideration:
- Start sending aggregation requests (S[Agg])
- Start sending advertisements (S[Adv])
- Start sending subscriptions (S[Sub])
- Start sending messages (S[Mes])
- End of measurement (E[Mes])
The impact of the different actions performed by the system can be illustrated best using experiments for throughput. This is because in throughput experiments we are trying to stress the system to its limits by the amount of publications that have to be processed. Please note that churn is not explored within this kind of experiment.
Thus, the Figures 1 - 3 below all refer to the same exemplary throughput experiment. A total of 36 machines are used for hosting the 16 brokers which serve 800 publishers and subscribers.
The following steps are performed during this throughput experiment: (1) After setting up the broker network, the publishers and subscribers send requests for the types of aggregations they are interested in; (2) publishers advertise and subscribers subscribe initially; (3) publishers start sending messages at pre-defined rates; (4) publishers are advised to stop sending messages indicating the end of the measurement period.
Figure 1 shows the CPU utilization over time across all machines hosting ASIA brokers. The green line represents the maximum CPU idleness measured across all machines while the red and the black lines represent the minimum and average CPU idleness respectively. Figure 2 shows boxplots of the summarizing CPU load during this experiment for each machine.
The figures show that (1) the throughput experiment is impacting the infrastructure but is never resulting in a CPU load of more than 80% across all machines hosting brokers; (2) the bulk sending of aggregation requests, subscriptions and advertisements in this scenario results in an increasing CPU activity as the information has to be filtered and processed in the broker network beforehand; (3) the main impact on the system is caused by the processing of publications and ends with the producers being advised to stop publishing.
The same holds for the memory usage. This is depicted in Figure 3 for the very same throughput experiment. It shows the increase in memory usage as all messages, subscriptions, advertisements and aggregations are kept in memory to be released after the end of measurement period.
To summarize, monitoring the resource utilization supports our claim that ASIA is adding functionality to a publish/subscribe system without negatively impacting its performance.
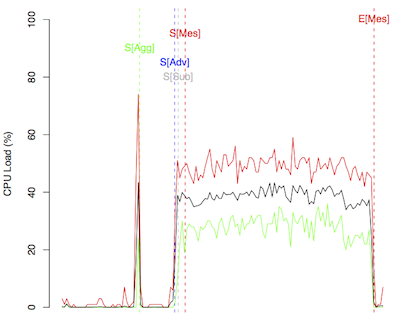
Figure 1: CPU load of the broker infrastructure for an exemplary throughput experiment in total over time
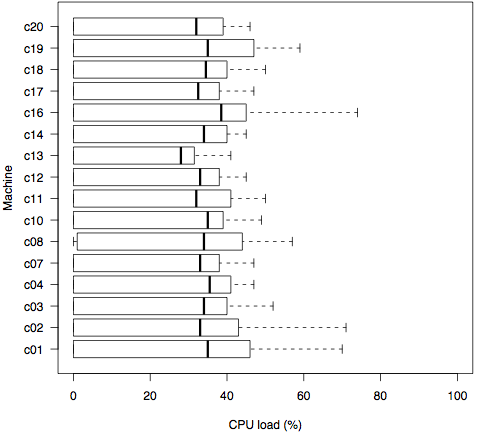
Figure 2: CPU load of the broker infrastructure for an exemplary throughput experiment in total by machine
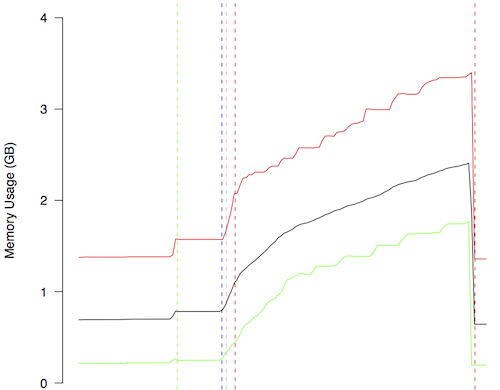
Figure 3: Memory usage of the broker infrastructure for an exemplary throughput experiment in total over time
Publications
|
Effective Runtime Monitoring of Distributed Event-Based Enterprise Systems with ASIA Sebastian Frischbier, Erman Turan, Michael Gesmann, Alessandro Margara, David Eyers, Patrick Eugster, Peter Pietzuch, Alejandro Buchmann IEEE 7th International Conference on Service-Oriented Computing and Applications (SOCA), November 2014 [PDF] [BibTeX] |
|
McCAT: Multi-cloud Cost-aware Transport Sebastian Frischbier, Alessandro Margara, Tobias Freundenreich, Patrick Eugster, David Eyers, Peter Pietzuch EuroSys'14 Poster Track, April 2014 [Website] [PDF] [BibTeX] |
|
Aggregation for Implicit Invocations Sebastian Frischbier, Alessandro Margara, Tobias Freudenreich, Patrick Eugster, David Eyers, Peter Pietzuch 12th International Conference on Aspect-Oriented Software Development (AOSD'13), March 2013 [Conference] [PDF] [BibTeX] |
|
ASIA: Application-Specific Integrated Aggregation for Publish/Subscribe Middleware Sebastian Frischbier, Alessandro Margara, Tobias Freudenreich, Patrick Eugster, David Eyers, Peter Pietzuch Middleware 2012 Posters and Demos Track, ACM, December 2012 [PDF] [BibTeX] |
|
Living in the Present: On-the-fly Information Processing in Scalable Web Architectures David Eyers, Tobias Freudenreich, Alessandro Magara, Sebastian Frischbier, Peter Pietzuch, Patrick Eugster 2nd International Workshop on Cloud Computing Platforms (CloudCP'12), April 2012 [Conference] [PDF] [BibTeX] |


 Print
Print Contact
 Legal note
 Search